Skills Summary Report
View overall Classworks individualized learning instruction completed. This summary of student work can be used to give students a Classworks grade by subject. The rigor of the work can be determined by comparing below, on, and above grade level time on task and number of units.
 This report reflects data for only completed/finished units.
Generating the Report
1. Navigate to the Reports tab then click Instruction in the menu options on the left.
2. Scroll to find Skills Summary then click create.
Give your report a name
Choose to Summarize By Selected Students or Individual Students
Selected Students: This totals all of the data for all of the students you selected and reports it by grade level.
Individual Student: This shows summary data for each individual student, as well as totals.
Select subjects (Mathematics, Language Arts, or both)
Date Range for the report
6. A preview of your report will appear! Click the down arrow or printer icons in the top right to print or download the report, or click the back arrow on the left to return to the settings if changes needed to be made.
What to Look For
As you read the report, notice the following items:
The number of students the data is reflecting for each grade level, teacher or class.
Is the majority of the time on task spent working in below, on or above grade level work? Is this consistent with the school's implementation plan?
The proficiency dot is reflective of the on-grade level work only.
How does the time on task and percentage compare to the other grade levels, teacher, classes or students?
The subject is listed at the top of the report. Are the students spending more time in one subject versus another? Is this consistent with the school's implementation plan?
Use the summary column to view the overall percentage and the total number of units completed for that subject.
For display by School, Teacher, or Class, the row titled “Totals” reflects averages of the display by option. For example, if you display by class, then the totals will be the average of the classes displayed. So each class is weighed equally regardless of the number of students with data in each class.
Skills Summary Report Guide
Example: Summarize by Selected Students
This report is segmented by Grade Level. Depending on the filters you chose, it could include a single grade or multiple grades.
Calculation of Summary % (last column) = The sum of each student's overall unit score average divided by the total number of students; this includes all work completed – below, on and above grade level.
Calculation of Totals (bottom row) = Totals and Average of the Display by Group. For display by schools, this would be the average of the grade levels (each grade level weighted equally).
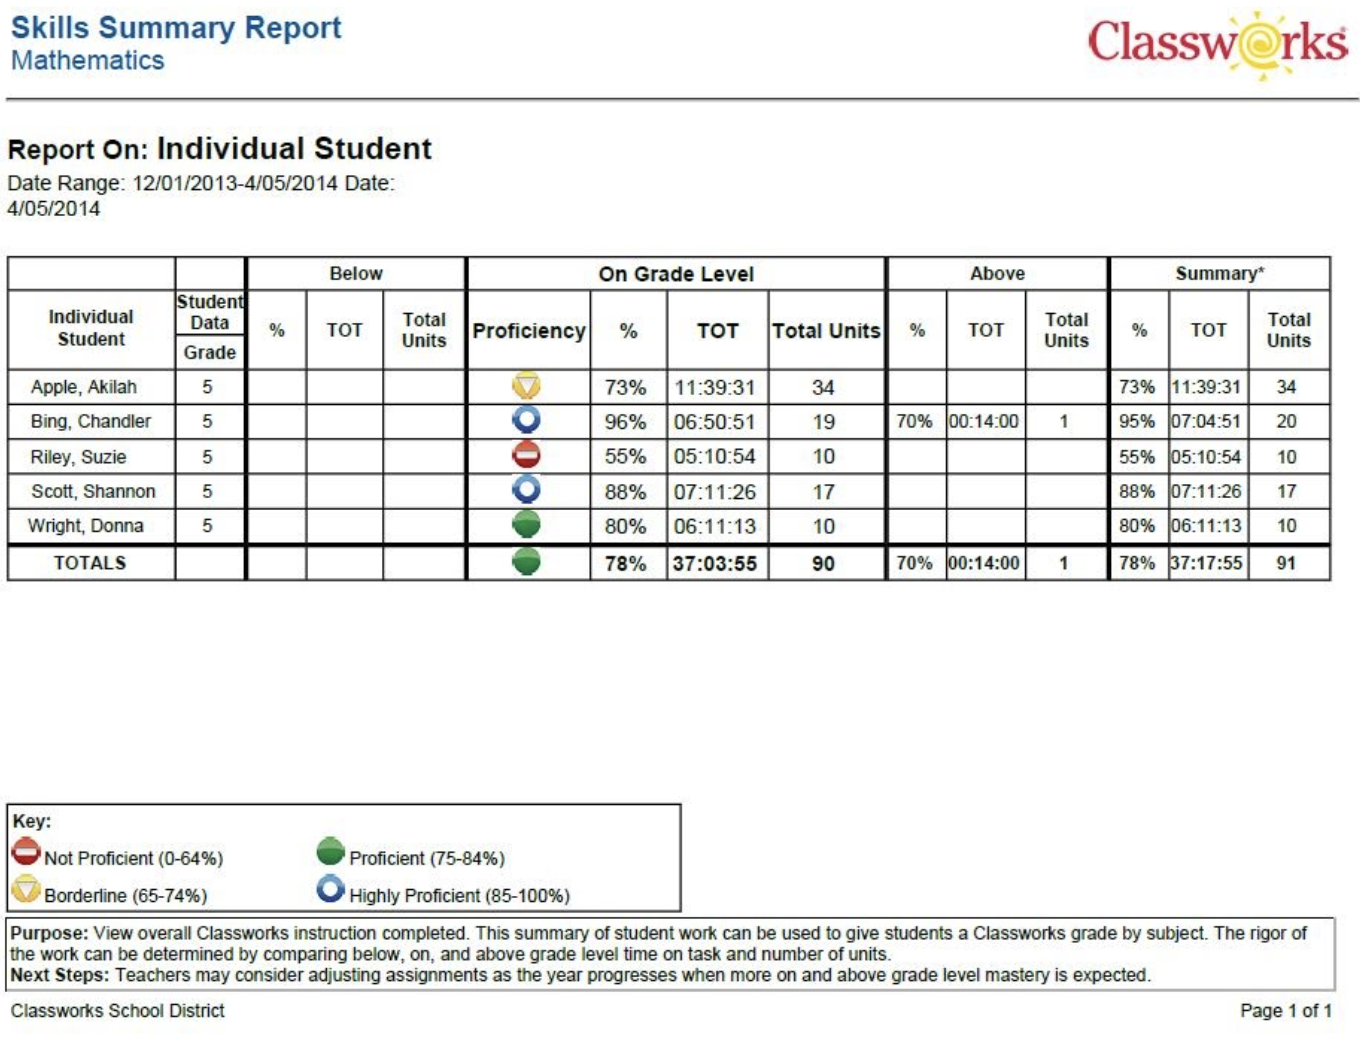
Example: Summarize by Individual Student
This reported is segmented by Individual Student. Depending on the filters you chose, it could include a single student or multiple students.
Calculation of Summary % (last column) = The sum of all unit scores divided by the number of units completed; this includes all work completed – below, on and above grade level.
Calculation of Totals (bottom row) = Totals and Average of the Display by Group. For display by student, this would be the average of the students (each student weighted equally).
Related Articles
Student Screener Summary Report
The Student Screener Summary is a parent report for teachers to share information on how students are doing in each testing window. The report provides an overview of both academic and social screening results. Teachers can share these resources with ...Student Usage Report
View all assessment and instruction data completed and in progress during the specified time frame! This is a great way to look at Classworks usage for a student, class, group, or school. This summary of student work can be used to track time-on-task ...Custom Assessment Results: Student Progress Report
A Custom Assessment is used to assess knowledge of particular skills, strands and/or standards. It can be administered frequently and is used to measure a small number of very specific skills or used broadly to measure a full nine-week period. It can ...Skills Snapshot Results Report
This report displays mastery of skills based on the Skills Snapshot assessment results as well as on the resulting Instructional Learning Path (ILP). Teachers are able to view the status for all skills on the assessment for an entire class or ...Skills Snapshot Results: Mastery Measurement Report
This report displays mastery of skills over time, allowing teachers to ensure learning is occurring at an acceptable rate. It can help you determine if time on task should increase or if the instructional path should be modified to accelerate ...